I'm documenting my project for wearables + netobjs here:
Joan Dress
It's code named Joan for now, for Joan of Arc, who had divine visions from above (i.e., the 'net, naturally!)
Basically, it's a dress augmented with conductive threads and thermochromic inks. The threads cause the inks to change color via resistance heating, and in response to network activity.
Showing posts with label data visualisation. Show all posts
Showing posts with label data visualisation. Show all posts
Thursday, April 05, 2007
Saturday, February 10, 2007
Sensors and Time
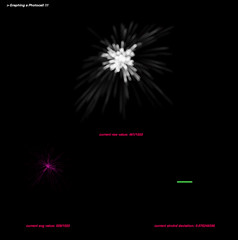
I built a little visualisation tool, using processing, for graphing sensor activity. In this case, I was specifically looking at a photocell. The nature of the data being sensed, in this case, light, informed the way I chose to display the data.
There are three parameters being graphed here: raw data, averaged readings, and the standard deviation between readings.
The circuit is really simple. It's just a photocell hooked up to an arduino board analog in pin. My arduino board communicates serially to my processing app, which then displays the data accordingly.
Download my code here: arduino | processing
Subscribe to:
Posts (Atom)