This week I made a lot of progress with the loom, which is good since the show is only 2 weeks away, and dress rehearsal less than 1 week away.
I got it all set up on the ITP floor, got my sensors hooked up, and am spending this next week composing and figuring out my performance.
I was experiencing a drawback with getting the wireless accelerometer data into max/msp, but finally ironed that out a minute ago; the WiTilt 2.5 from SparkFun is a great little device, but there are some pitfalls to watch out for, which caused me many hours of frustration. Here are some tips:
- after you connect to the WiTilt over its serial port, make sure you hit the onboard reset button twice. Only after doing this was I able to get into the config screen from zterm (or terminal) in order to set the device up.
- when you configure the WiTilt, make sure the data is being sent out as 'raw data'. This will send everything out as ascii.
- once you are in max and connected to the WiTilt's serial port, don't forget that you won't be seeing the config screen (unless you are printing the incoming data after sending it through the atoi object), so just trust that after you hit the reset button twice and start getting a string of characters (which should be the config menu converted to dec values), you need to send a '1' character (49) in order to get the data stream started.
- conversely, send a spacebar character (32) to stop the data stream
- the best way to parse out the values you want from the data stream (which will be coming at you in ascii as something like X=392 Y=772 Z=857), is to use regular expressions. I configured my WiTilt to only send me values along the Y-axis, so i was getting a continuous stream of Y=553 (or whatever current reading was). I pulled that data in from the serial port into max, converted the ascii to an integer (atoi), and then used the following regular expression with the max regexp object to get the sensor value: ([\\d+]*)
That regex will take all the numbers out of the incoming serial packet and append them one after another, thus giving you a complete sensor reading (instead of giving you the reading as individual numbers. i.e. 583 coming to you as 5, 8, 3).
The thing that screwed me up the most in the beginning was forgetting to hit the reset button on the WiTilt. I'd sit there insanely frustrated, wondering why the config menu wasn't coming up. Unless I missed it after reading the datasheet a million times (which is still possible I guess), it's not noted by SparkFun that you have to do this. So when in doubt, hit the reset button!
Okay, so the other problem was my stretch sensor wasn't giving me values. That was just a result of a bad connection on the breadboard.
Other things that I have to do is size the yarn. Because it's wool, it's sticking to itself, so to speak. Wool fibers are composed of gazillions of tiny barbs that hook onto each other (which is why felting exists), and to get around this, you need to 'size' your wool, or soak it in water and elmer's glue, basically. One of my upright beams warped and cracked as well, so that was unfortunate.
So for next week, the plan is:
- build a stand for the loom (so it doesn't have to lean up against the wall)
- size my yarn
- compose
- implement xbee circuits so i can transmit sensor values wirelessly (although this will probably not be the version I use in the show, just in case something screwy happens last minute. Wires are much reliable)
Showing posts with label sensors. Show all posts
Showing posts with label sensors. Show all posts
Monday, December 03, 2007
Tuesday, November 27, 2007
Loom: Update 6
Okay, I'm still waiting for a space to set my loom up in. And my cat got sick on my laptop, thereby killing it (it's not salvageable apparently) and cutting my access to my max/msp and arduino files thusfar developed. Not a great week.
But I did make some progress, despite that. I re-did my warp, as it wasn't long enough the first time I made it, and it went A LOT faster the second time around (about 2 hours vs, uh, 10 hours last time). So that is now finally complete and attached to my top beam. Other things completed:
- Got the correct bolts in my top beam supports. It's all bolted up to the uprights and ready to go.
_ Got my shed stick cut and bolted to the bottom of the loom (for separating the front and back threads from each other)
- Put together xbee/accelerometer circuits to go on five of the 24 weights hanging from the warp
- Got my shuttle put together with the wireless accelerometer sensor + a lithium battery
- Rewrote my max patch to where it was before
Oh yes, the xbee is an addition, heh. I am combining this final with my Mesh Networking final, and making the weights wireless devices that send their values remotely. I will be keeping a wired version of the code and board handy though, in case some kind of wireless mishap takes place, which seems to always be a danger, and I don't want any of that at showtime.
This next week is just wrapping everything up I guess and well, getting the xbee stuff all working flawlessly as well as tweaking the sound still.
Tuesday, October 23, 2007
Kick Me: Finished!
We got our xbee/fsr controlled kick game for Mesh Networking working today!
The icons come out on a broadcasted beat, which our xbee picks up, and then are 'kicked' to one of four environments, depending on which force sensor pad the player stomps on.
So okay, we aren't actually 'kicking' anymore; it's now 'Stomp Me'. Or alternately Kick (Stomp) - A - Mole (Icon).
Anyways, here's a screen cap:

And the Processing source code:
SRC
Tuesday, October 16, 2007
xbee game (as yet unnamed)
My group and I decided to make a little foot-eye coordination game, coordinated to a xbee broadcasted beat. The parts to our project are as such:
- a physical interface consisting of a kick pad with FSRs in them, for recording which pad was kicked and how hard.
- the hardware involving an xbee and arduino, for capturing the broadcast beats and fsr readings
- the software, processing, for displaying our environment, which will be updated per the data sent over from our arduino.
Basically, our processing environment consists of four areas: a forest, a city, a desert, and a river. The screen will be divided into four equal parts for each eco-system. Moving along the bottom of the screen (coordinated to every 2nd broadcast beat) will be a conveyor belt, carrying with it three different kinds of icons: an egg, a baby, or a seed:
These icons will drop onto the conveyor belt in coordination with the broadcasted beat. Depending on which FSR pad you kick, you can send each of these icons out into one of the four environments. How hard you kick the pad will determine how far out 'into' the screen the icon travels. Finally, depending on which icon you kicked and which environment it landed in, the egg/seed/baby will grow into a specific animal/plant/character. For example, if you kick the baby into the city/desert/forest/river, you will get:
So far, we have designed our icons and have the core architecture of the processing program in place. We also have been able to pick up the broadcasted beat and are working on putting together a kick pad.
We have divided up the labor as such:
Shin-yi + Sarah: Graphics/Animation/Processing programming
Daniel + Shilya: Kick pads and hardware programming
- a physical interface consisting of a kick pad with FSRs in them, for recording which pad was kicked and how hard.
- the hardware involving an xbee and arduino, for capturing the broadcast beats and fsr readings
- the software, processing, for displaying our environment, which will be updated per the data sent over from our arduino.
Basically, our processing environment consists of four areas: a forest, a city, a desert, and a river. The screen will be divided into four equal parts for each eco-system. Moving along the bottom of the screen (coordinated to every 2nd broadcast beat) will be a conveyor belt, carrying with it three different kinds of icons: an egg, a baby, or a seed:
 |  |  |
These icons will drop onto the conveyor belt in coordination with the broadcasted beat. Depending on which FSR pad you kick, you can send each of these icons out into one of the four environments. How hard you kick the pad will determine how far out 'into' the screen the icon travels. Finally, depending on which icon you kicked and which environment it landed in, the egg/seed/baby will grow into a specific animal/plant/character. For example, if you kick the baby into the city/desert/forest/river, you will get:
 |  |  |  |
So far, we have designed our icons and have the core architecture of the processing program in place. We also have been able to pick up the broadcasted beat and are working on putting together a kick pad.
We have divided up the labor as such:
Shin-yi + Sarah: Graphics/Animation/Processing programming
Daniel + Shilya: Kick pads and hardware programming
Monday, October 01, 2007
Quick pcomp sketch
So I was asked to make a little device that addresses a problem on the ITP floor. Well, 'problem' is a very subjective term, and it turned out that my 'problem' with the ITP floor wasn't as much of one for anyone else, thereby pointing out that I might be a little OCD. oh well.
The problem I chose to tackle was the one of the pcomp lab's tool box drawers not always being fully shut (photo coming soon). It's not a *huge* problem to me, but an issue nonetheless, however petty it might be. And anyways, it's the one I chose to solve, so here you go:
doorbell
Originally uploaded by 0x000000
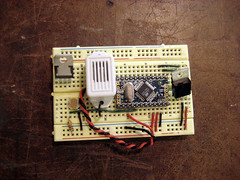
This device is just a photocell + a doorbell buzzer. When the arduino reads a value off the photocell of less than 200 for more than 10 seconds (ideally, this would be set to a couple minutes, so people have time to open the drawer and shuffle about for their item), a very loud, obnoxious, annoying buzz goes off, until the drawer is fully shut again.
arduino src
The problem I chose to tackle was the one of the pcomp lab's tool box drawers not always being fully shut (photo coming soon). It's not a *huge* problem to me, but an issue nonetheless, however petty it might be. And anyways, it's the one I chose to solve, so here you go:
doorbell
Originally uploaded by 0x000000
This device is just a photocell + a doorbell buzzer. When the arduino reads a value off the photocell of less than 200 for more than 10 seconds (ideally, this would be set to a couple minutes, so people have time to open the drawer and shuffle about for their item), a very loud, obnoxious, annoying buzz goes off, until the drawer is fully shut again.
arduino src
Monday, April 23, 2007
Actions, Events, and Filtering
I wrote a program in processing that reacts to how vigorously you shake an accelerometer.
The arduino communicates the sensor's readings through a serial connection to processing. I used a smoothing function, in my arduino code, to get clean values from the accelerometer, which tends to give very eradict readings otherwise.
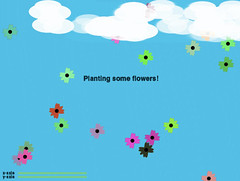
When you first open up the processing app, it is a calm, blue day.
If you make it so that the sensor's readings match up on the x- and y-axis, you plant flowers on the screen.
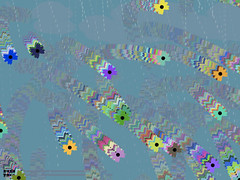
Slightly shaking it causes the blooms to blow...
Quickly shaking it causes a rain storm (and all the flowers blow away)
Leaving the sensor alone for 10 seconds let's the storm go away, returning you to a clear day.
Download Processing and Arduino code
The arduino communicates the sensor's readings through a serial connection to processing. I used a smoothing function, in my arduino code, to get clean values from the accelerometer, which tends to give very eradict readings otherwise.
When you first open up the processing app, it is a calm, blue day.

If you make it so that the sensor's readings match up on the x- and y-axis, you plant flowers on the screen.
Slightly shaking it causes the blooms to blow...

Quickly shaking it causes a rain storm (and all the flowers blow away)
Leaving the sensor alone for 10 seconds let's the storm go away, returning you to a clear day.
Download Processing and Arduino code
Monday, April 09, 2007
American Museum of Natural History
My Sensor Workshop class went by the American Museum of Natural History last week, and got to take a look at their newest permanent exhibit, the Hall of Human Origins. We also got a special behind-the-scenes peek at the workshops where they construct the dioramas on display in the museum.
I was particularly interested in seeing this exhibit, since my old academic roots lie in human evolution and primate sociobiology. Yes, I was a physical anthropology major as an undergrad before switching to design + art, and I still have a strong interest in the going-ons of this field.
Anyways, our task for the day was to think about improvements that could be made to the exhibit, as far as interaction design go. In other words, how could we make the exhibit more engaging, inviting, and clearer to understand for the visitors, all of whom come from many age groups, cultural backgrounds, and levels of education.
There was one display in particular which I thought was on the right track, but just didn't quite make it to the finish line, in terms of being easy to use and understand. It was a large back-lit illustrated map of the world, mounted against one wall, with a second display set in front of it, divided into segments corresponding to different regions of the world. Each of these segments had a description of the region it represented, complete with a touch sensitive, die-cut button that activated the faint tracing of a line on the mounted map, representing immigration into those regions. Each region's line had its own color to help it stand out from the others. This, however, was not enough to get everything across clearly.
The immediate problems with this display were the following:
- After touching a region's button (operative word is 'touching', not 'pushing'... something like a qprox touch sensor was used here), a colored line of very diffuse light would begin to slowly lurch its way from one point on the map to another. The light was in fact so diffuse, it was nearly impossible to spot for all but one region.
- The line tracing took place very slowly, with a significant delay after touching a region's button. It felt as though it was broken at times, like nothing was going to ever happen.
- The button itself was problematic. There was really no good reason to have a touch button in place of a traditional push button. There is something very satisfying and final about actually getting to push a button down, and hear it click back up. It affirms for you that an action has taken place, and will (hopefully) result in some kind of action. When I tried to push the buttons installed for this display, it felt incomplete, and very unsatisfying to have this huge cut-out shape unable to be pushed down.
So right away, it'd be great if at least the lines were much brighter and clearer, and if the buttons had a little more tactile feedback for the user. Also, obviously, the time between activating the button and actually seeing something happen on the map, should be shortened.
Saturday, February 10, 2007
Sensors and Time
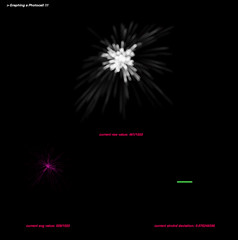
I built a little visualisation tool, using processing, for graphing sensor activity. In this case, I was specifically looking at a photocell. The nature of the data being sensed, in this case, light, informed the way I chose to display the data.
There are three parameters being graphed here: raw data, averaged readings, and the standard deviation between readings.
The circuit is really simple. It's just a photocell hooked up to an arduino board analog in pin. My arduino board communicates serially to my processing app, which then displays the data accordingly.
Download my code here: arduino | processing
Subscribe to:
Posts (Atom)