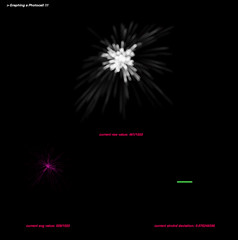
I built a little visualisation tool, using processing, for graphing sensor activity. In this case, I was specifically looking at a photocell. The nature of the data being sensed, in this case, light, informed the way I chose to display the data.
There are three parameters being graphed here: raw data, averaged readings, and the standard deviation between readings.
The circuit is really simple. It's just a photocell hooked up to an arduino board analog in pin. My arduino board communicates serially to my processing app, which then displays the data accordingly.
Download my code here: arduino | processing
Subscribe to:
Post Comments (Atom)

1 comment:
wow looks cool, you should get an applet up online so we can see it... or maybe a video.
Post a Comment